It’s a strategic framework that is almost as famous as SWOT and has been commonly used since the late 1960s, let’s find out more about this famous matrix…
What is the BCG Growth-Share Matrix?
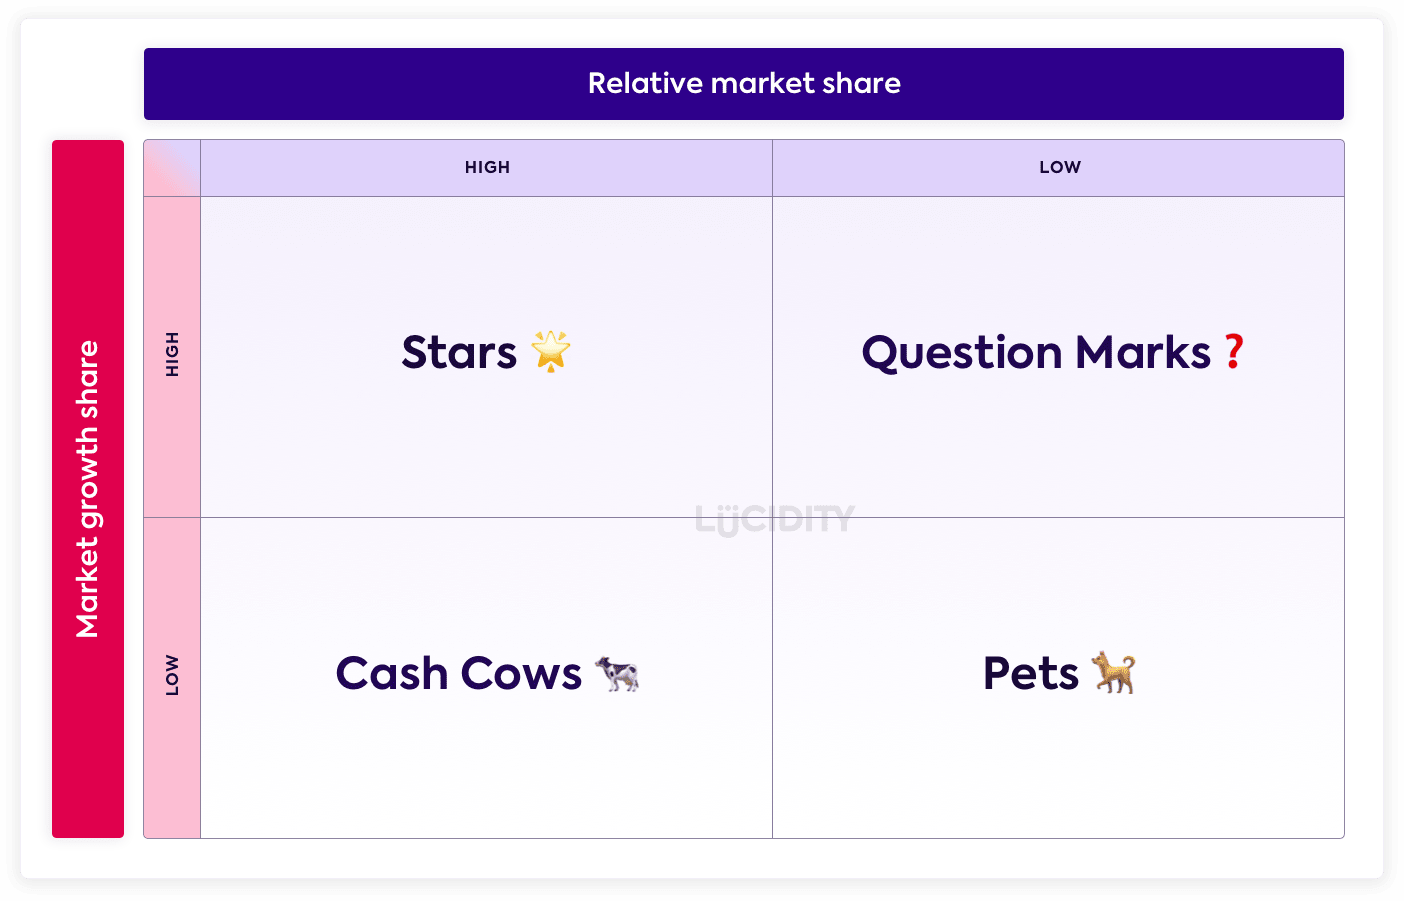
The BCG Growth-Share Matrix is a framework used to classify products or services in order to aid decision making. The model is presented as a 2×2 matrix and can be applied to any product or service.

The two measurement dimension are Market Share and Growth Rate, using a combination of these provides four quadrants:
- High Growth, High Share
- High Growth, Low Share
- Low Growth, High Share
- Low Growth, Low Share
These are given the terms:
- Star
- Question Mark
- Cash Cow
- Pet (sometimes referred to as Dog)
What should a company do with Star products or services?
A Star is a High Growth, High Share. Companies are advised to invest in these as they have significant potential in the future. In an ideal situation all of your products and services would migrate towards Star.
What should a company do with Question Mark products or services?
This is the toughest quadrant as there may be great potential in these items, or they may be not worth the investment. A company should decide if they are to continue investment here depending on the chance of them moving to a Star.
What should a company do with Cash Cows products or services?
Cash Cow products and services generate significant revenue but may be coming to the end of their life, hence slow growth. Companies should take the revenue generated and look to invest it in to other products in an attempt to create future Star or Cash Cows.
What should a company do with Pet products or services?
Pet products and services are low growth and low market share, and can often drag a business down in resources, focus and energy. The suggested approach is to divest or retire the items in this quadrant, as they will not be adding value to the business.
What are the advantages of BCG Growth-Share Matrix?
The BCG Growth-Share Matrix has several advantages:
- It’s simple to understand and use
- It works for all markets and companies
- There’s an easy process to complete
- It can be quite factual and based on financial data
- You can do it on your own, as a team in person, or as a group remotely
- It can provide a single snapshot of your full portfolio
- It suggests potential actions and next steps
What are some of the limitations of the BCG Growth-Share Matrix?
While it’s a great tool, BCG Growth-Share Matrix has some shotfalls:
- The two dimensions of growth & share are not the only factors to consider when deciding to invest or sunset a product or service
- There is no relation between the items on the chart, meaning in reality a Pet could be producing higher revenue than a Cash Cow
- It’s tempting to become subjective in the judgement of growth without market context
What are the alternatives to the BCG Growth-Share Matrix?
One of the main alternatives to the BCG Growth-Share Matrix is the ADL Matrix, otherwise known as the Strategic Condition Matrix.
Who invented BCG Growth-Share Matrix?
The BCG Growth-Share Matrix was created by Bruce Henderson in 1968, published in a short essay called Perspectives.
What preparation is needed for completing a BCG Growth-Share Matrix?
To complete a BCG Growth-Share Matrix correctly you should have prepared the following on each of your products and services:
- Financial performance information
- Growth rate
- Market information and size
A BCG Growth-Share Matrix is best reviewed as a management team so clear actions and decisions can be made about the future of each item.
How often is BCG Growth-Share Matrix updated?
The BCG Growth-Share Matrix is best updated whenever a company is reviewing their full portfolio and approach to market.


