Metric & KPI Tracking Software
Never lose sight of your performance
Keep track of all your metrics and performance measures
Fast, central access to your most up-to-date performance metrics, across all strategies and all teams. Simple to set up and effortless to track. Connect Lucidity with your systems and choose how you want to track it. You won't have to chase to update your data, everything is automatic in here with all your important metrics in one central location for your organization to track.
Adapt to your organization
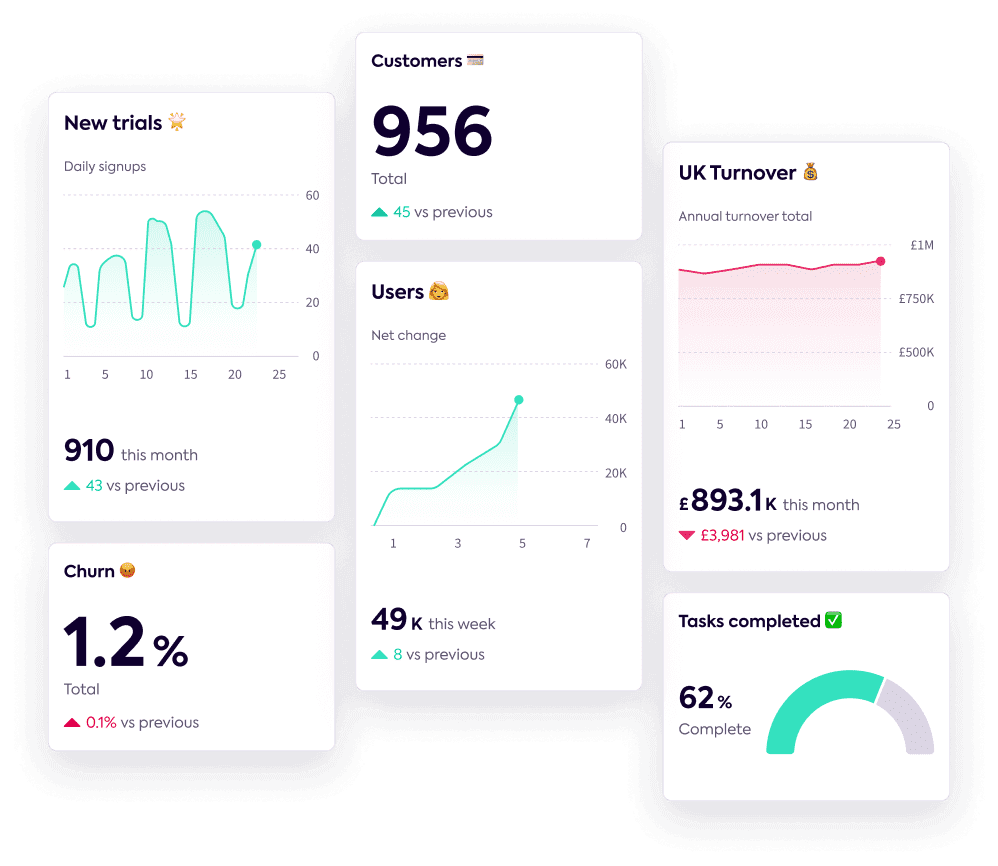
Create and Track any metric
Our metric tracker is fully flexible so you can create any kind of performance indicator for any team or team member across your organization. You can measure any unit across whatever timeframe you need. From customer numbers to plant pots. One place to track all the important metrics for your success and ensure you are making data-driven decisions.
Automatic updates
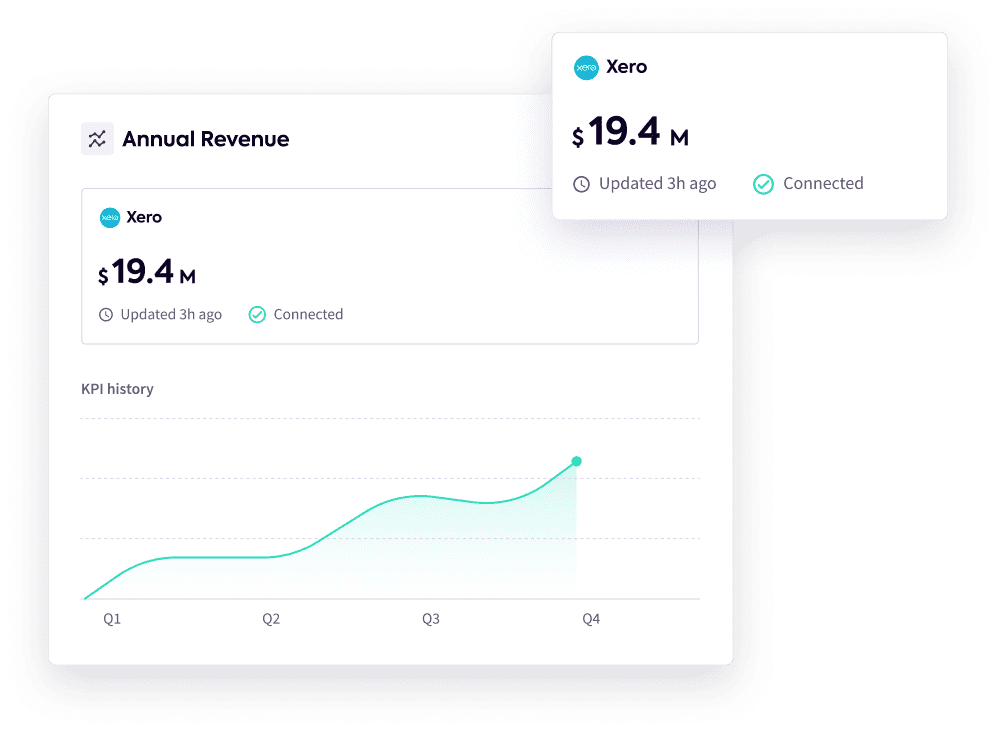
Always up-to-date
Use our quick and easy integrations to sync your metrics and KPIs with the systems that hold your data and get instant access to the latest results. Update your data as frequently as every hour and save time looking in for different performance statistics. ull the numbers from each system into one, clear and automatic metric tracker.
Joined-up approach
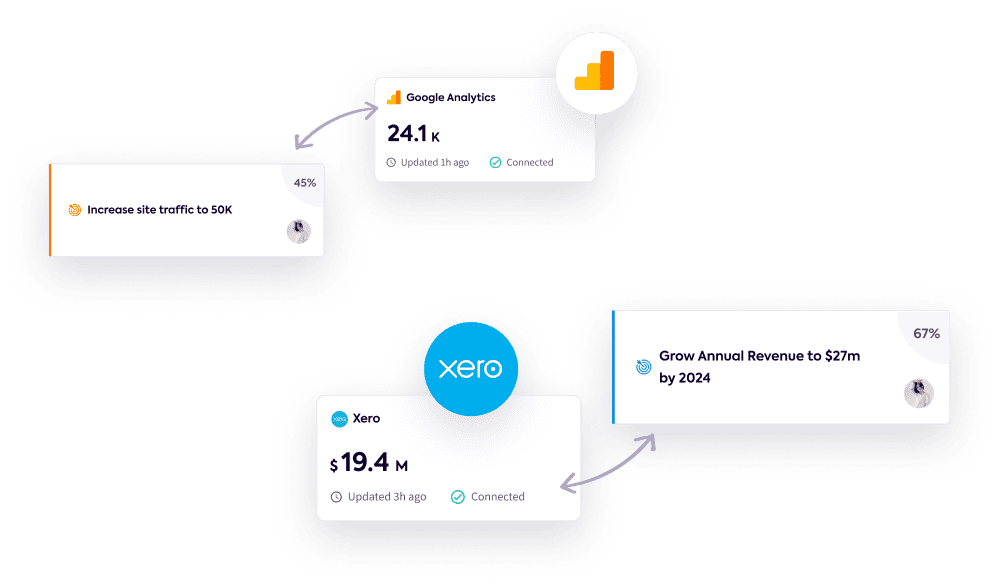
Linked to your strategic goals
Easily connect your KPIs to the strategic goals in your strategy that set a clear target for that metric. There’s no need to double up, or have two places to update, just associate the KPI with the goal and as Lucidity tracks your KPI, it’ll update your goal progress.
Always aligned
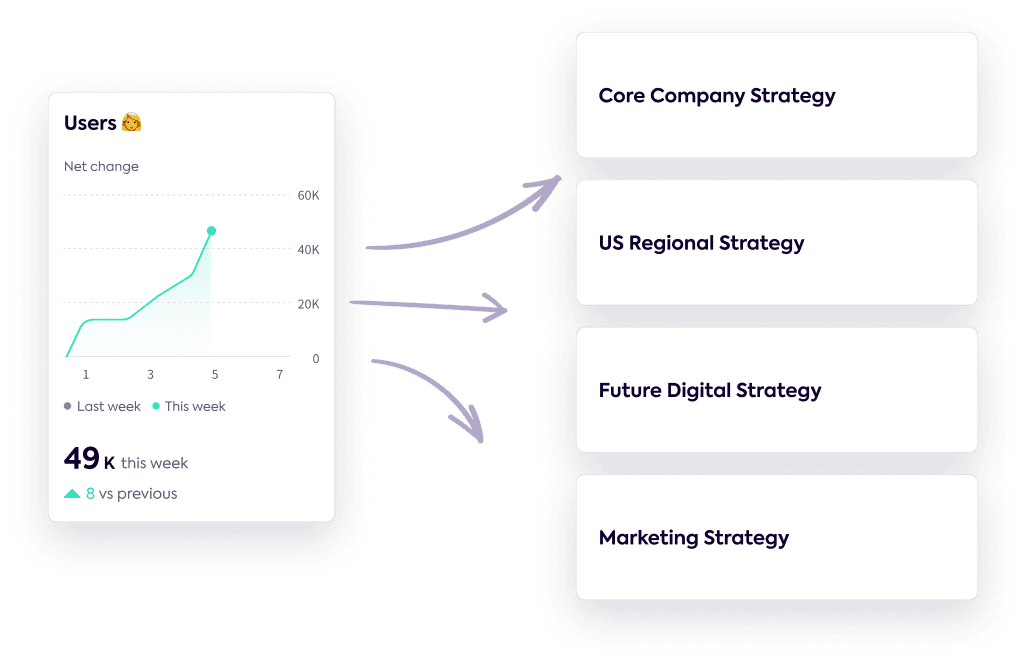
Shared for strategic cohesion
Create your KPIs centrally and share across all your strategies. With these consistent metrics connecting multiple plans across your organisation you can keep departmental heads and leaders aligned and going in the same direction, strategically planning around the same numbers. All your strategies properly joined up for the best chance of overall business success.
Easily accessible
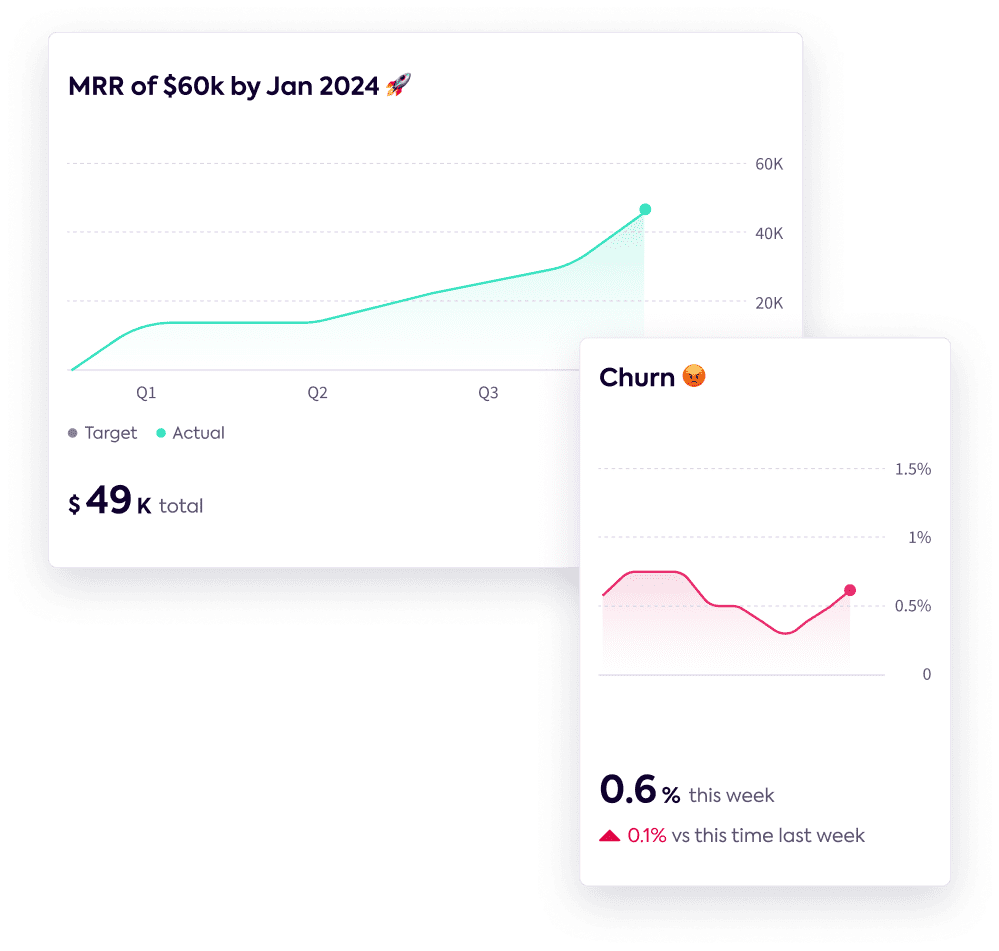
Quick to understand
See at a glance if performance is going well. With automatic graphs you’ll get a fast, visual indicator of whether your metrics are going in the right direction. Simply confirm whether you’re aiming for an increase or decrease and watch the graphs turn red or green. Enhance communication within your team, fostering transparency and collaboration within your team.
You'll love Lucidity if you want to
Easily monitor performance
Gain a clear understanding of how well your organization's progress.
Maintain your competitive advantage
Stay ahead by keeping informed and adapting as needed.
Keep your teams aligned with your goals
Ensure everyone is working towards organizational objective.
Just a sample of our metric tracking features...
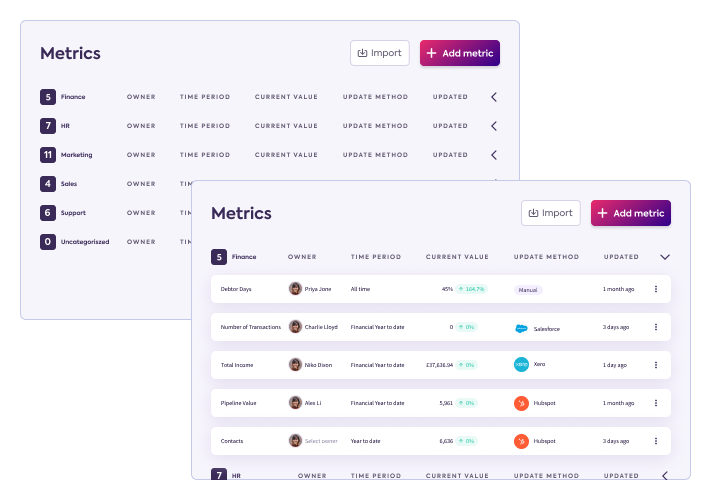
Your library of metrics
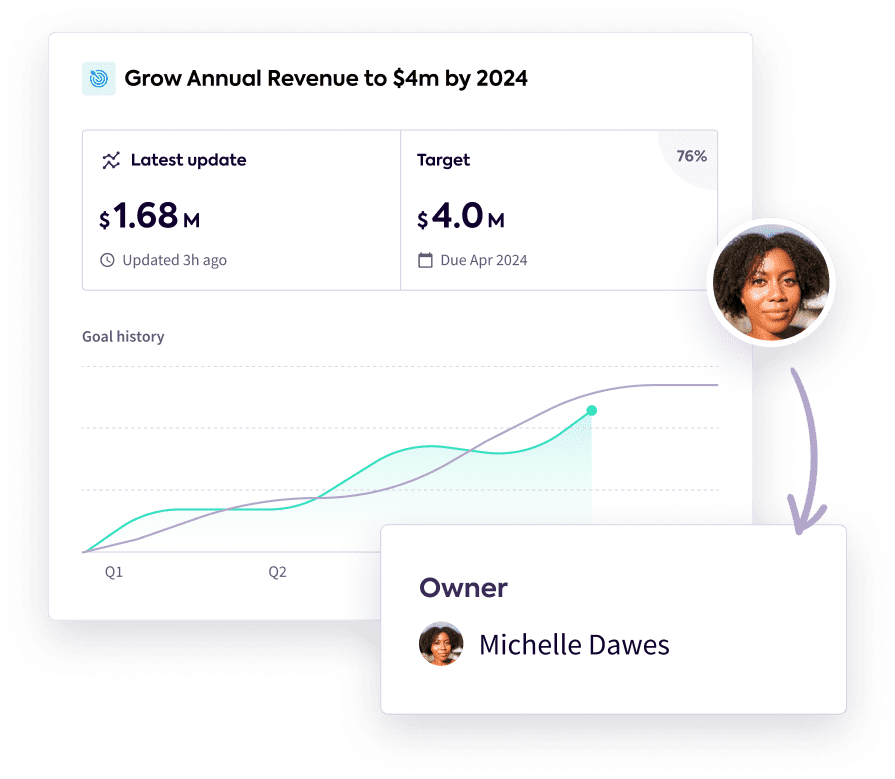
Assign owners for accountability
Set the direction
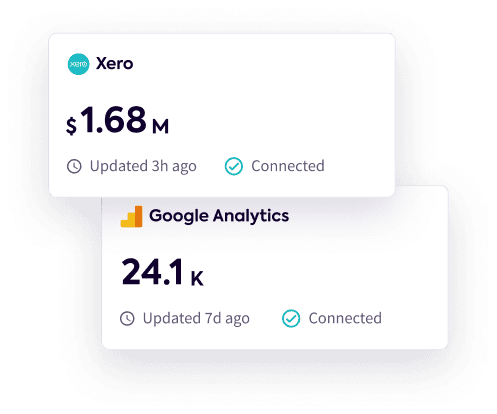
Choose update method

Trusted by