Strategy Tracking & Reporting Software
Engage and inform everyone
Always know what’s going on
Keep on top of progress with instant access to your most up-to-date results. Get a broad view of performance all in one place, with data pulled from across the business. Never before have you had such clarity on the performance of your strategy.
Always up to date
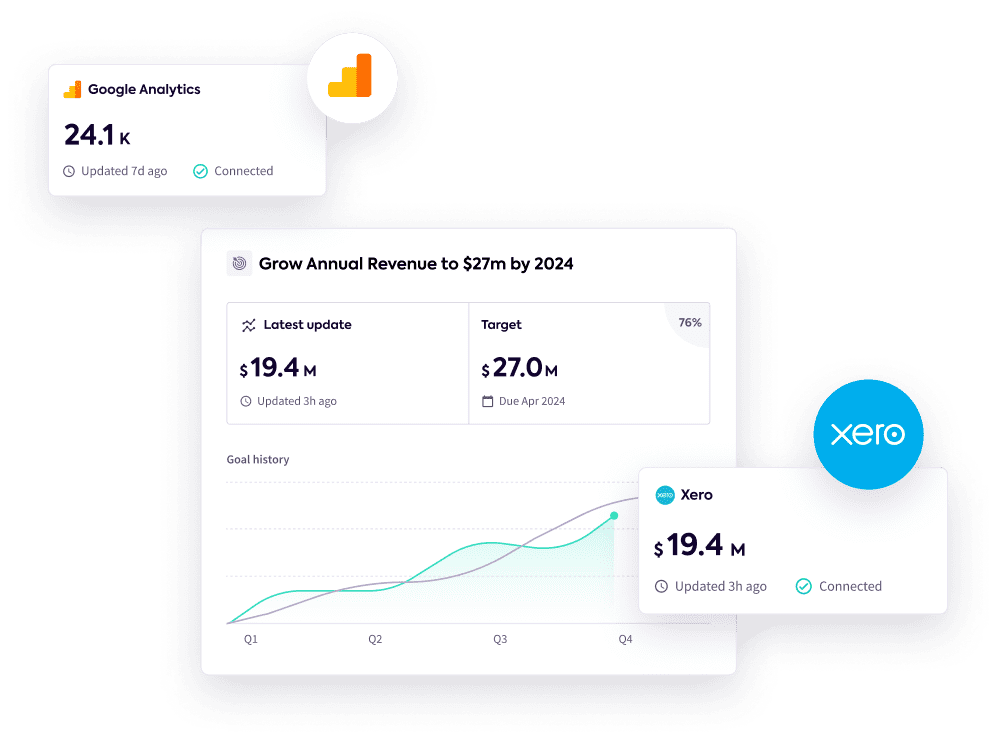
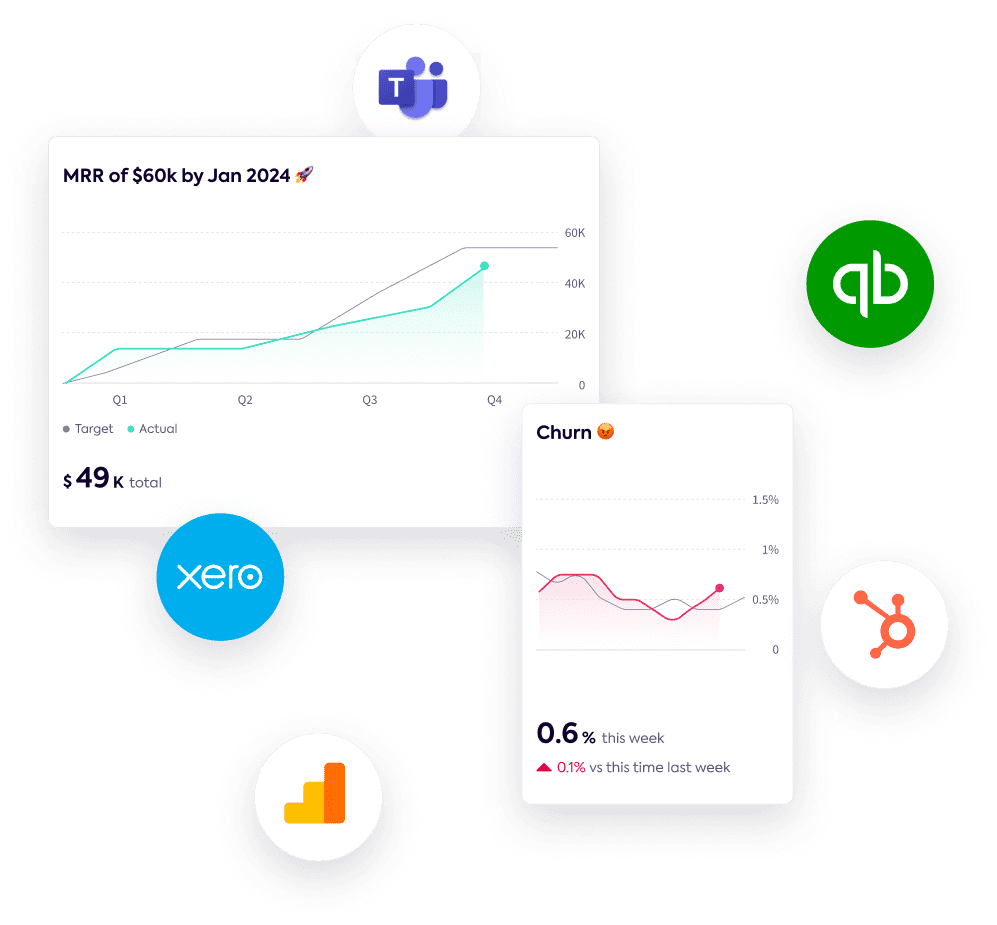
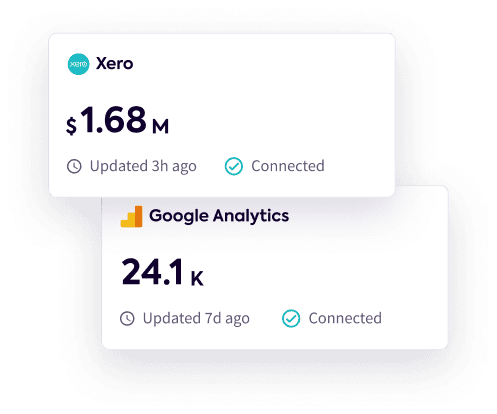
Integrated and automated to save you hours
All your important strategic data pulled together so you can effortlessly stay informed. No more scrabbling around for data, looking in different systems, chasing people for their numbers. Integrate with your business systems with a couple of clicks and have all your results in one place and always up-to-date.
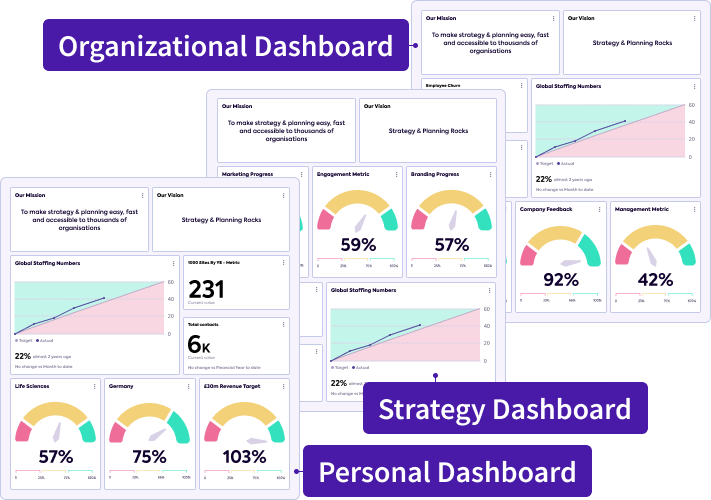
Multiple Dashboards
Different views for different people
Let the CEO set the Organisational Level Dashboard for the board, all employees and other stakeholders. And let the team set the Dashboard for the strategy they are working on. And how about every individual having their own Strategy Dashboard to look at exactly what they personally want to track. With Lucidity you can set all of that up in seconds.
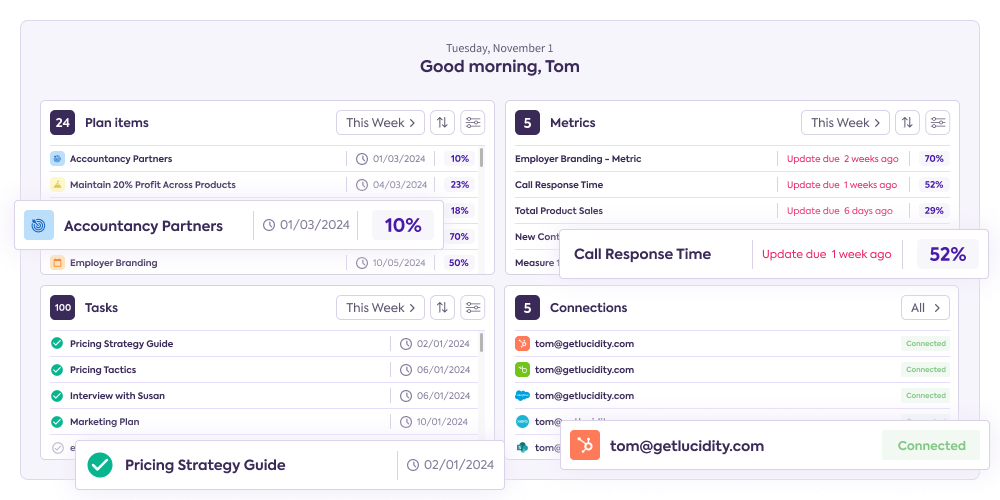
Engage & Inform Every Individual
Personal Homepage
Good Morning You! Engaging employees was difficult until we gave everyone their Personal Homepage. Now everyone can see what they are personally involved in, giving or receiving strategy updates – all in a single place. Time saving bliss.
Just a sample of Dashboard updates...
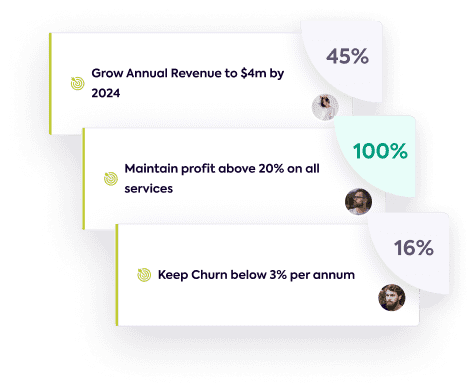
Overall strategy progress
All your goals and targets
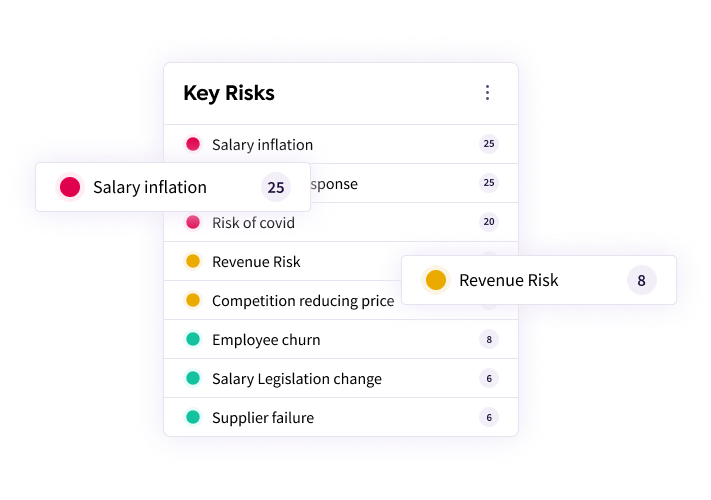
Key Risks
Any KPI or OKR
Reporting tools that make it crystal clear
Easy to set up, simple to understand. Powerful, yet wonderfully uncomplicated. All our tracking and reporting tools are designed to give clear and uncluttered views of your most important results.
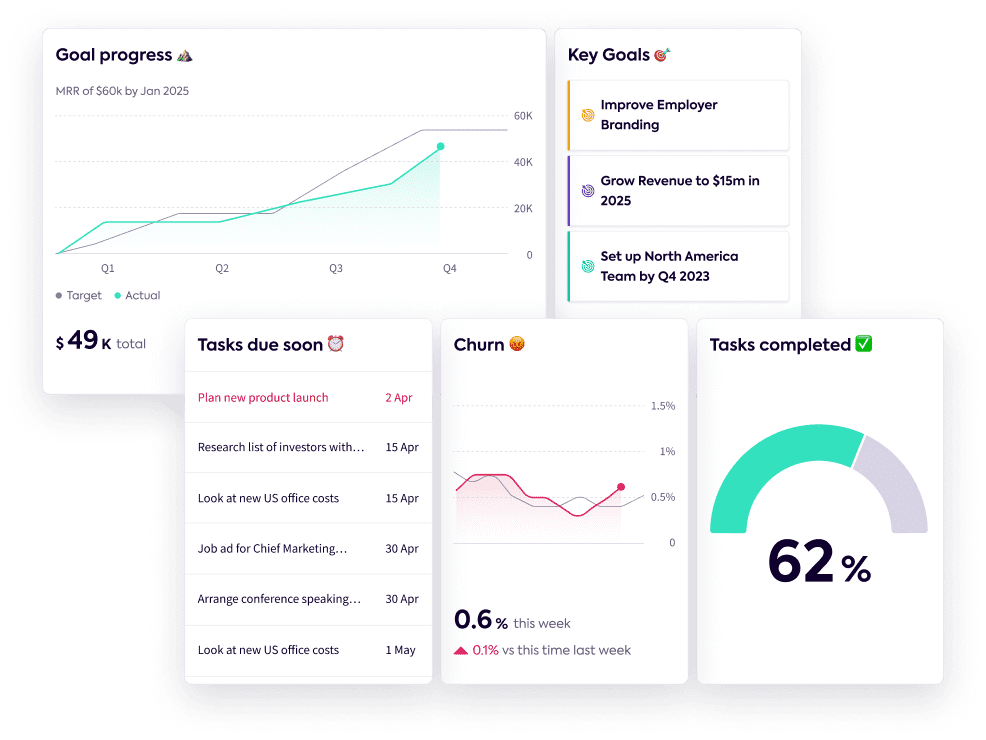
Strategy dashboard
Configure your own views, choose the goals you want to track, see upcoming tasks and get quick links to take you into the detail.
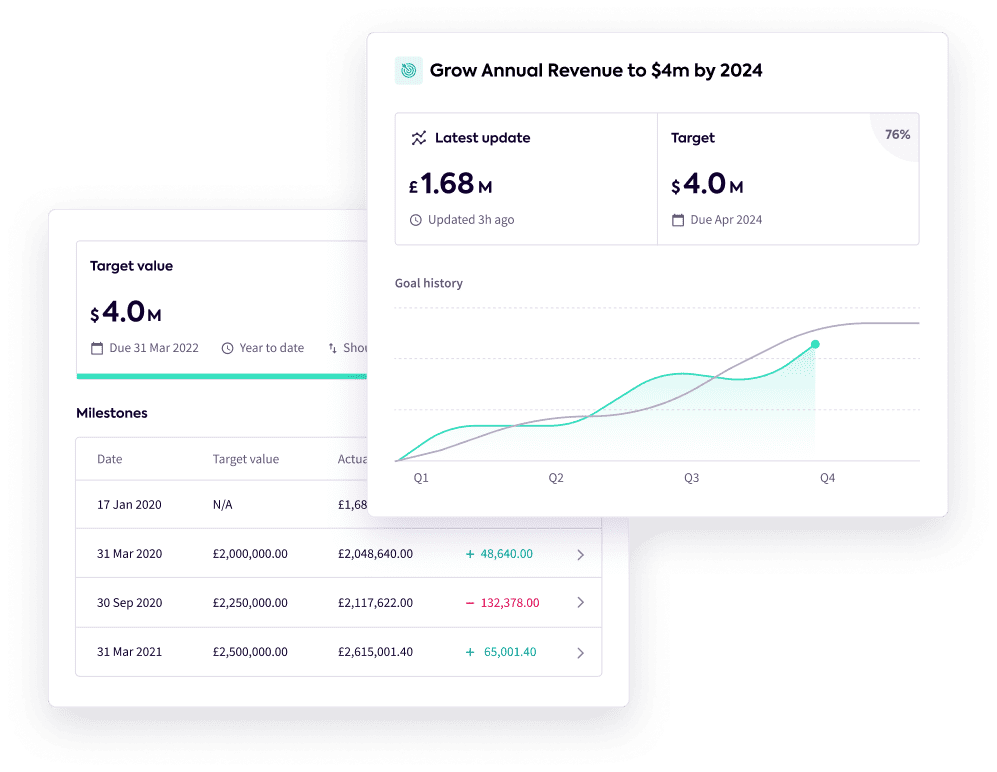
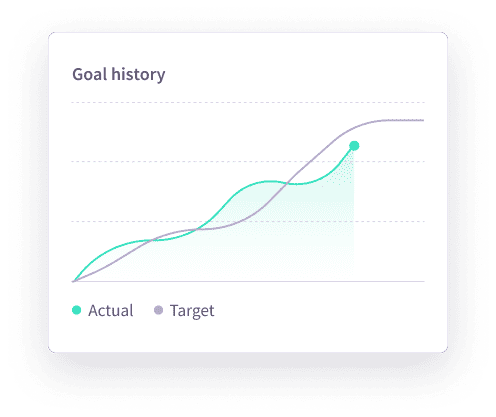
Book Your DemoGoal reports
See results quickly with clear graphs, track progress milestones, record update history and track your task completion.
Get Your DemoKPI tracker
Create KPIs, sync with your existing systems, associate them with goals and get fast indicators of performance with clear graphs.
Find out more